Features
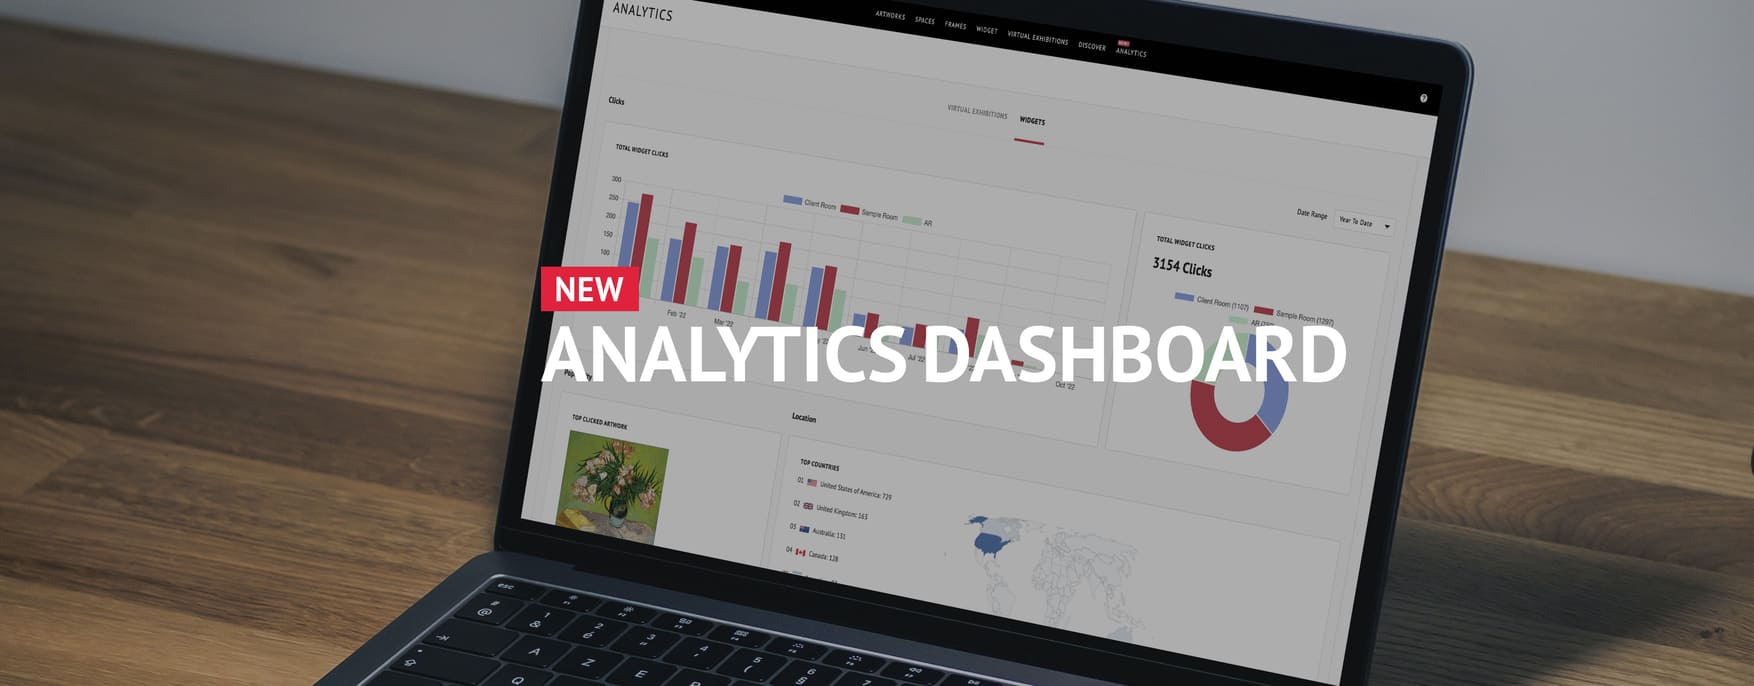
Analytics for Virtual Exhibitions and Website Integrations are now here
We want to bring the best art marketing tools to help you promote, and sell your art. That’s why we have added a new feature that will help you better understand your audience and provide them with a frictionless experience to acquire your artworks.
Meet ArtPlacer’s Analytics for Virtual Exhibitions and Website Integrations.
Analytics help you track how your art marketing efforts are performing.
Contents
What is ArtPlacer’s Analytics
From now on, when you activate ArtPlacer’s Website Integrations on your webpage or publish a new Virtual Exhibition, you will have access to an Analytics Dashboard and get important data that will give you a clearer view of your art marketing strategy.
What analytics will you be able to track?
Virtual Exhibitions Analytics:
-Virtual Exhibition visits: check the number of single visits your art show is receiving.
-Most visited Virtual Exhibition: which one of your Virtual Exhibitions is gathering the most attention.
-Top countries: where your audience is coming from.
-ROI – Return on Investment: an insight into your art marketing efforts that clarifies which parts of the strategy need adjustments and which are bringing positive results.
All this data can give you a rich insight into how visitors to your virtual exhibitions or professional website behave. It is key to know your audience, what their interests are, and how you can reach out and turn visitors into potential clients.
Of course, all this data is precious information. ArtPlacer is committed to working with the highest privacy standards. Check our Privacy Policy for further details.
Website Integration (Widget) Analytics:
-Widget clicks: know how many times visitors have clicked on each of your active widget buttons.
-Widget clicks by Type: Sample Room, Client Room, Augmented Reality.
-Top clicked artworks: see what your visitors are most attracted to.
-Top countries: check where your visitors come from.
-ROI – Return on Investment: a comparison of your marketing efforts vs. the revenue you are getting from it. A key measurement to know which efforts to push based on how profitable they are.

ArtPlacer’s Analytics is a quick way to see how your audience interacts with your art pieces.
How to access Analytics for Virtual Exhibitions and Website Integrations
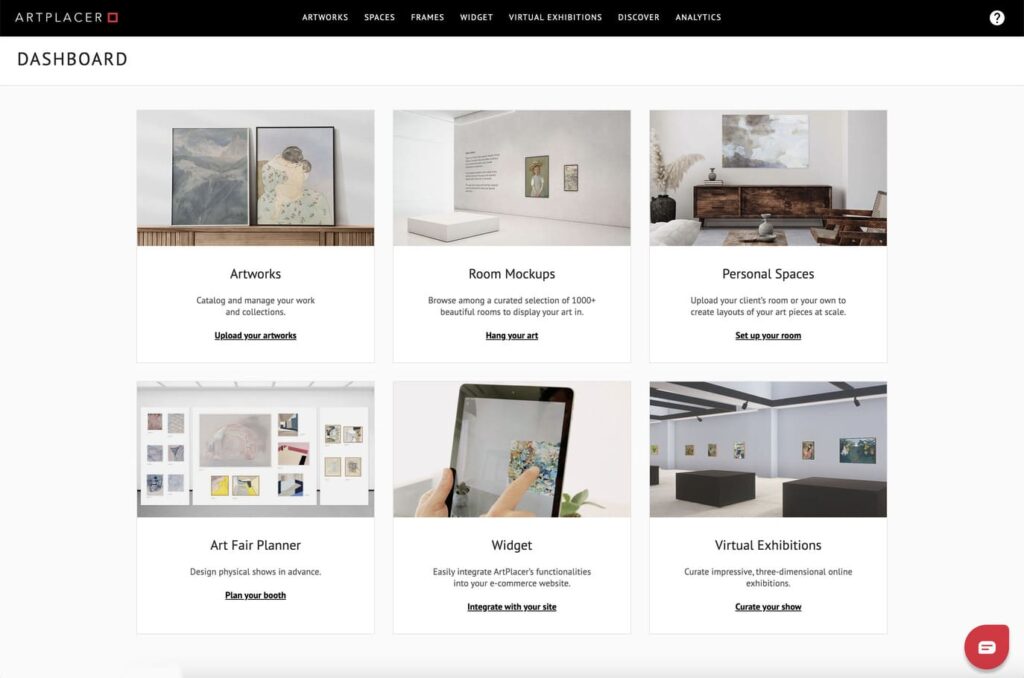
Log in to your ArtPlacer account. Look at the top menu on your desktop or your left panel if you are on mobile or tablet, there you will find the “Analytics” button. Click on it to see your current data.
What to do now?
-Click on the tab of the analytics you want to see: Virtual Exhibitions or Website Integrations (Widgets).
-Once you select the feature you want to check, choose the time frame for the analytics you want to see on the dropdown menu at the top right of the dashboard.
-Then you’ll see the data for that time frame: including widget clicks, top clicked artworks, top countries, ROI for Website Integrations, and for Virtual Exhibitions. the number of visits, most visited exhibitions, top countries, and ROl.

Taking a deep look at your analytics gives you information about your potential clients and how to reach out to them.
How to use analytics for Virtual Exhibitions and Website Integrations
The best part of accessing this data in an easy-to-digest way, is to quickly get a full view of how your art marketing efforts are coming through. Visualizing the data to create your own report or tracking will now be a simple task to tackle.
With ArtPlacer’s Analytics, you can see how your ROI evolves. If you’re not familiar with the term, ROI refers to Return on investment, a ratio that points to how your art marketing investment is performing taking into account its cost.
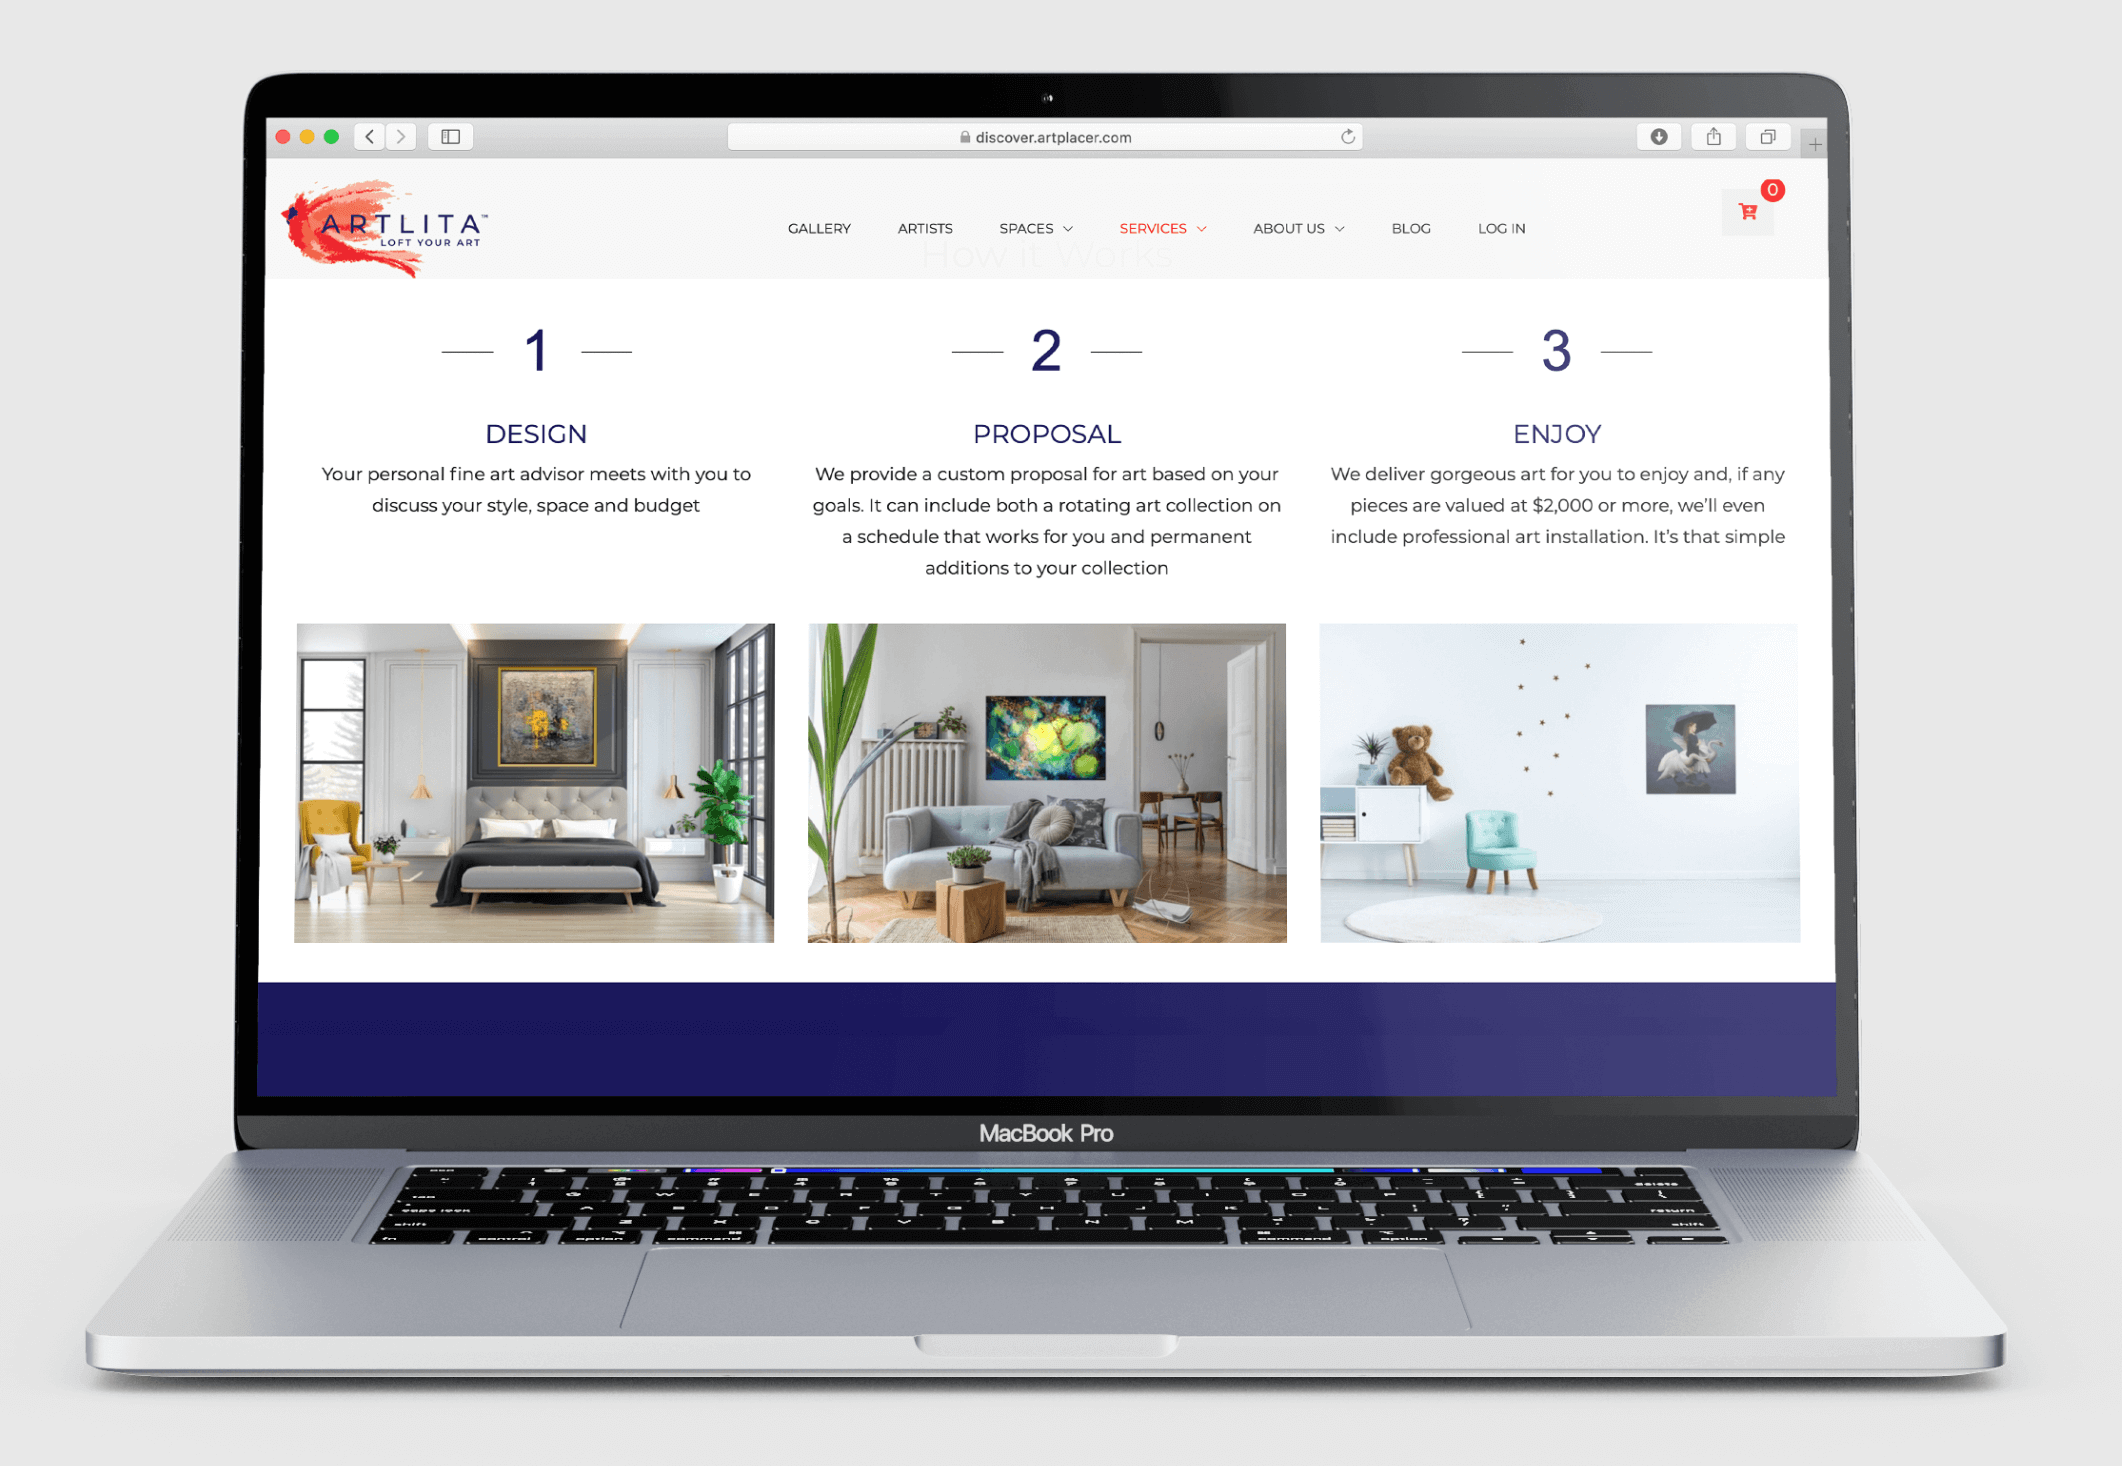
Website Integrations like the “Client Room”, “Sample Room” and “Augmented Reality” give potential clients a great “Try Before You Buy” experience. Knowing how your audience interacts with them and who is part of this group of active users is key to improving the strategies used to reach out to them, and planning future interactions.
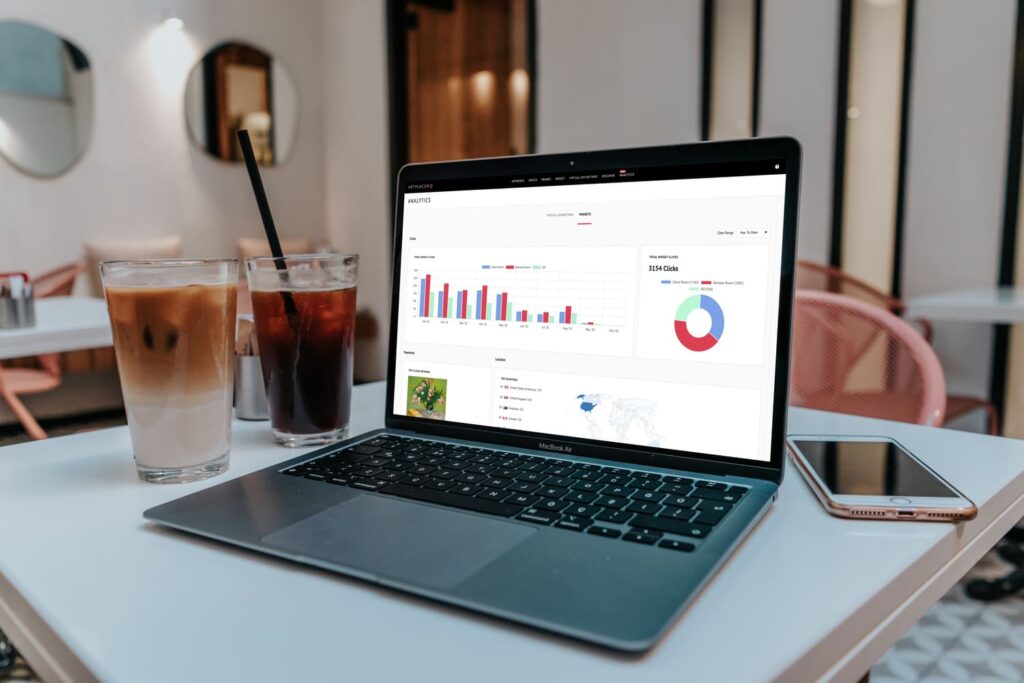
Take a look at your first ArtPlacer’s Analytics Dashboard and let us know what you think!